Market Stress Index: Introducing the MSI

There are many tools out there that attempt to quantify the emotional extremes of the market. When we created one, we had one goal: we wanted it to have an actual edge.
This meant carefully researching the inputs that would go into the measure, and limiting it to factors which actually have a statistical edge in shaping market direction. There's a tendency with these things to think "more is better", but the truth is that more is often worse. If there's too much overlap ("multicollinearity" is the formal term) then our model will lose predictive power.
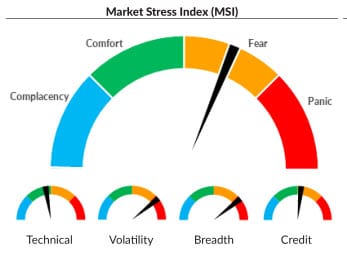
So, we created the Market Stress Index, which consists of four sub-indexes:
- A technical index that looks at several factors relating to trend, stability (one of the most important aspects and one completely ignored by most standard tools), and momentum
- A volatility index that looks at the option markets' assessment of risk
- A breadth index that uses volume and stock movement to find extremes. (I believe most technical analysts use breadth in almost exactly the wrong way. It's not a tool to show driving force behind a move; it's a most powerful tool to show when everyone is probably leaning the wrong and, and is wrong.)
- A credit stress index that looks at the relationship between different tranches of debt
Here's the current reading, as of close 6/3/19, for the MSI:

While a tool like this is good for helping to find extremes, it's also good to remind us when we are nowhere near historical extremes. This is the current situation--we are relatively mid-range and tilting toward "fear", but nowhere near levels that we take to indicate a buy.
You might ask how this tool has performed in the past. Here's a look at the buy and sell levels (which are specific levels on the tool) presented as color bars on the S&P 500 index.

The MSI does not give a signal often, but when it does, we should listen.


