Knowing the future with market stats

So, you’ve seen the headlines and, if you somehow missed it when it happened, you know that last week was a period of historically high volatility in the stock indexes. It seems every finance twitter posted something along those lines, but one important thing is missing: what comes next?
This is what I want to think about today—the difference between statistics that tell you what just happened, and statistics that tell you what might be just around the corner. The two are very different. Anyone can create an endless stream of market “stats” looking at what just happened, but it’s much harder to find things with predictive value.
And the bad news is that the answers are often unsatisfying!
History matters
Market history matters—a lot. While only a fool expects history to repeat literally, history certainly rhymes, and the past is our best guide to the future. It’s a far more reasonable guess that “the future will look something like what we’ve seen before” than to say “something that has never happened before will happen.”
This is why it’s important to know your history: knowing what the market has done in the past can give us great insights into what is likely to happen in the future.
Observations vs. predictions
We might think that statistics are concrete, easy things. After all, numbers are numbers and you can’t argue with math, right? Again, this is a facile argument because there’s a lot under the surface.
So just how big was a market move? Should we look at point changes? Percent changes? Volatility-adjusted changes? Maybe we should look at single days, or swings (then how do we define the swings), or maybe some lookback? Maybe a week is better than a day? Should it be a Monday-Friday week or trailing 5 trading days? As we think deeper (and we must think deeper!) the questions pile up!
Once we start answering some of these questions, then we run into figuring out what, if any, trading edge might lie in the immediate future.
Dangerous waters
Be careful, because it’s easy to make mistakes. Once we start digging into statistics, we invariably find that some things work better than others. Imagine a process where someone looks at some high level statistics, and only keeps those that show a little edge. Next, that person adds other conditions, and, again, only keeps the sets that show an edge. Add a few more conditions, and repeat until eventually something shows a strong prediction.
This isn’t to imply manipulation or falsehood. While someone, somewhere, sometime might do this to create a clickbait headline, traders also do this themselves in backtesting and system development. In fact, it’s one of the thorniest problems that people new to backtesting face, and there’s no perfect solution. (The best solution is to be suspicious of any result that has gone through multiple stages in selection and refining.)
The results from such an exploration will often show a strong directional edge for the future, very good fit (high “hit rate” in the past—like “18 out of 20 times this has happened…”), and strong predictive power. But it’s all a lie. These types of statistics don’t hold up at all, and having a faulty map is more dangerous than no map at all. At least, when you don’t have a map, you know you’re lost!
Current market conditions
This weekend I spent many hours tearing the current environment apart. Here are some highlights:
- Last week’s move in major indexes was historically large.
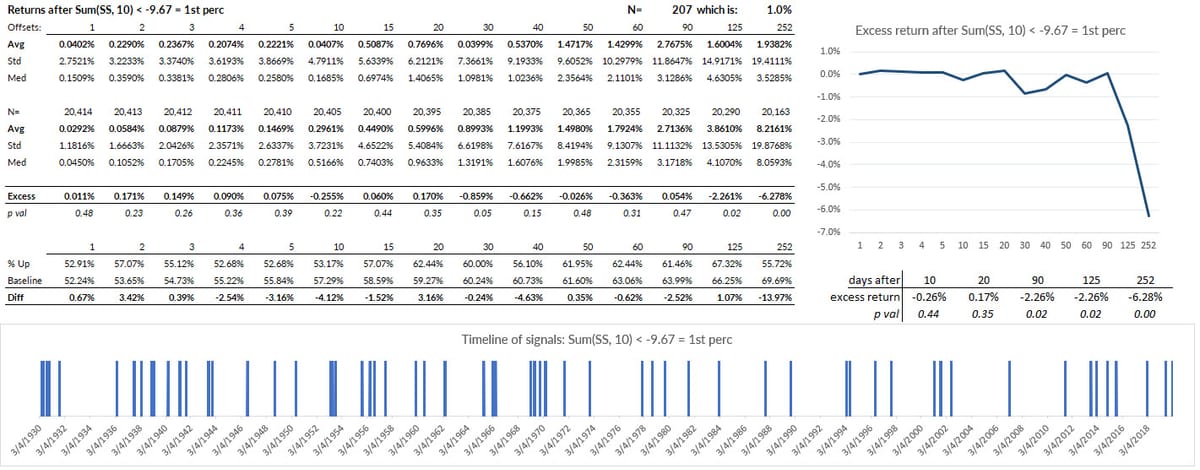
- Measured on both a volatility-adjusted and raw percentage basis, this was within the top 10 (out of many thousands) of events observed in the past.
- We can also look at measures of “surprise”. Think, for instance, about isolating declines that happen from new highs, or measuring how fast a market rips from the top of a band (Bollingers or Keltners) to the bottom. By these “surprise” measures, last week’s action was also extreme.
- By nearly any reckoning, we saw a 99thpercentile event in the market.
But—here’s the unsatisfying answer—there is no clear statistical edge going forward.
It’s easy to find studies showing an edge for both underperformance and outperformance, depending what criteria you put into the model. Many times in the past decade, we’ve had market moves that have shown clear edges, and I’ve written about many of those here on this blog.
Today, just a reminder to not assume that historical extremes lead to any easy predictions. The less we assume in this market, the better we will be.


