Is this weird or not? The daily relationship between the S&P 500 and the VIX.
As I was wrapping up a Friday afternoon and getting ready to go play outside, I saw a post in a Facebook group where a guy asked what was up with the market because this was a rare day on which the market was down, and so was the VIX.
I thought this was a good teachable moment, so I dusted off an old analytical graph (from 2013... yikes!)

The intuition that volatility tends to increase as stocks go down is correct, but to really answer this question we need to dig a bit deeper. The first thing to do is to ask what the normal relationship between the market and the VIX is.
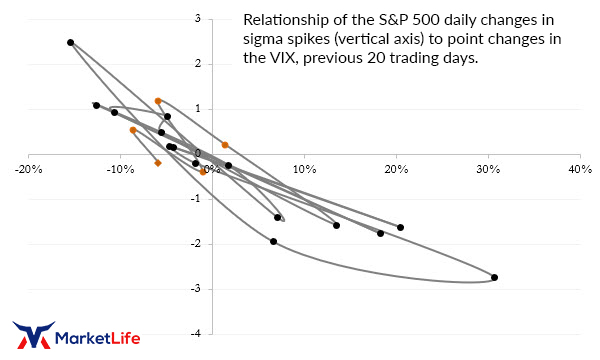
This chart is one way. On the vertical axis, we measure the daily change in the SP500 as a sigma spike against the point change of the VIX on the horizontal. The past 20 trading days are chained together in time series with the line (which can be a little hard to read.)
From this, you can see Friday (the orange triangle at the end of the line) wasn't that far out of line with the norm, and that there are other days when the market goes down and the VIX also declines. In other words, it's not really that unusual to have the market off a little bit and to see implieds (if we assume VIX is a reasonable proxy for implieds) also decline.
However, we DO see one outlier... see the day the market was down less than -3 sigma and the VIX was up over 30 points? THAT day (3/22) the rally in the VIX was overdone and traders can use information like this to know when it might make sense to short vol.
Easy takeaway from this graph: just look at the normal relationship between the market and VIX on a day to day basis to know if it's "out of whack" or normal. The adaptation here is that I measure in sigma spikes instead of percentages, but you can do very well with just percentages. (Note that you DO NOT want to look at a percent of a percent... so consider the VIX (which is already a percent) in point changes NOT percents.)


