What should you expect after a big drop in stocks?
We've had a very large decline in stocks this week. Depending on what index you use and how you measure, it's the biggest or one of the biggest in the past few years. The world is also tense with geopolitical concerns: economic numbers from major economies are conflicted, world leaders exchange tense words, and the threat of armed conflict, even of a nuclear exchange, seems more real than it has at any time in the past few decades.
Add to this an investing environment that already challenges investors and traders alike: volatility has been historically low, key groups of stocks have failed leadership, and many traders are frustrated at every turn. People, especially talking heads and social media commentators, are on the wrong side of moves with stunning regularity, but even level heads are asking "how much longer can this bull market go?"
We don't know the answer to that question (or to any of the questions raised by the concerns above), but we do have some guidelines. Take a look at the following chart, which shows what happened following the eight biggest declines in the S&P futures over the past five years. This is not an easy chart to read. In fact, it's an ugly chart (and I'm sorry--I abhor ugly charts), but there's an important lesson to this presentation.
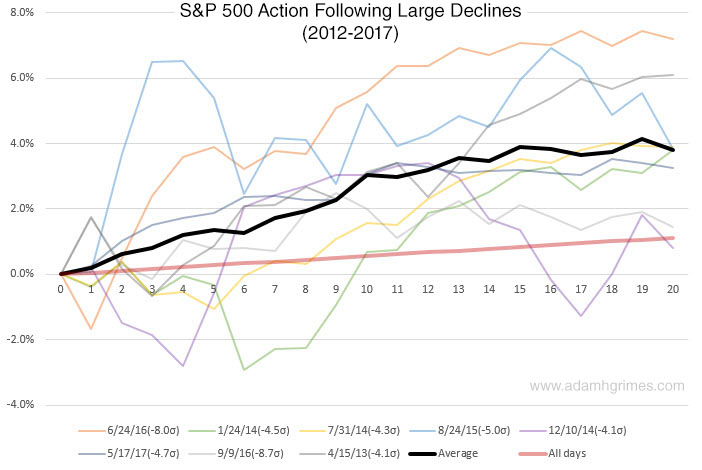
A little explanation is in order: This chart shows what happened each of 20 trading days following the large single-day declines indicated. The large declines are measured in sigmas (standard deviations of the past 20 trading days) rather than percent changes or points, so these are volatility-adjusted large declines. (You'd get very similar results no matter how you define the declines.) Each of the light traces is price path (in percentage terms) following the corresponding day. The heavy black line is the average of all the days on this chart, and the thick red line (labeled "All Days") is the average of all days in the S&P. This is important because it shows the baseline drift we can expect from stocks.
It's clear from this chart that 1) stocks tend to snap back rather strongly following large single-day declines. It looks like we're up about 4%, on average, a month later, while the S&P usually only goes up about a percent a month. There's also a wide range of outcomes: we've been up over 7% a month later, but all of the days in this study were positive 20 trading days following a decline. There was some pain: we can see a few of the days continued to decline, with a couple going down about another 3% over the next week or so, but the overwhelming tendency is up.
Lessons
What do we do with this information? Well, I know there are all kinds of flashy sayings like "Never cross a river because it is, on average, a foot deep", and "trade the averages if you want average returns", but what better guide do we have? If we want to understand the market, don't we want to understand what usually happens?
Now, maybe this time is different. Maybe something will happen in the world that will send stocks down 10% next week. It's possible, but, to my thinking, it's the ultimate arrogance for me to assume that I can say this is the time that is different! It usually is not different. The best guide to our actions is understand what the market usually does, and applying that knowledge within a disciplined framework of risk management. This is how we make money in the market, folks.
Other lessons: When we talk about averages, it's easy to forget that some very large deviations from those averages do happen. Our results are only meaningful over a large sample of trades, and the market can certainly throw us some surprises. This sample size is very small, and you might raise the objection that the past five years were an abnormal market environment. (Good point, and here's a blog post that basically does the same thing I've done here for a longer time period back.)
So, temper your fear. Put aside your political concerns and unease about what the future might hold. This time might be different... but it probably won't be.


