Death and golden crosses: a deeper look
Last week, I wrote a post looking at the (apparently) impending Death Cross in the Russell 2000 index. In that post and the data examined, I found an interesting and statistically significant short-term signal for the Death Cross, but no effect for the Golden Cross. I suggested that this was worthy of further investigation, and that is the point of today's post. Today, I will look at the Death and Golden Crosses on much more data. First, the DJIA going back to the 1920's, and then on a large basket of stocks from more recent trading. I'll also discuss a bit more about test procedures, and what I have found to be the most common opportunities to make mistakes that will cost you money.
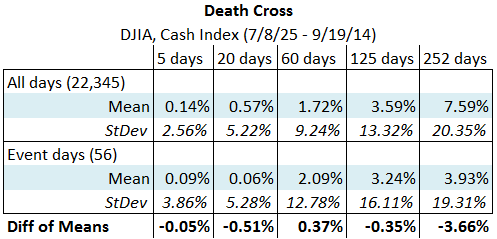
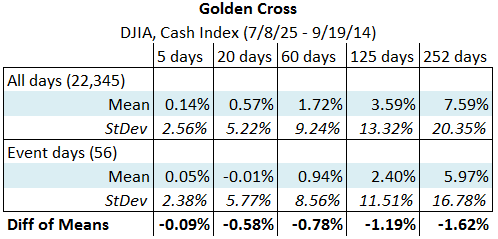
The sample size for the Russell 2000 test was quite small, with only 19 events to examine. Let's take a look at an index with much larger history, the Dow Jones index going back to the mid 1920's. Here are the statistics for both Crosses on that index:


This test includes more events, and shows a very different picture from what we saw before. Now, there appears to be no effect at all, though we might note with some curiosity that the excess returns, for both crosses, seem to be pretty consistently negative. (Though we cannot tell from these tables, none of these numbers are statistically significant, meaning that we are quite likely looking at noise.) This test seems to show no effect whatsoever from the Crosses, and we could draw the conclusion that we should probably not pay any attention whatsoever to them. However, here is our first cautionary note:
[box type = "info"] Caution: More may not necessarily be better
In examining more data, we have gone back further in time. It is certainly possible that older data does not relate to current conditions. Something (or many things) could have changed. In all analysis, we make the assumption that "the future will look something like the past", but this is an assumption that is worth considering carefully. In this case, it seems reasonable to assume that any effect would be more or less stable, but this may not always be the case. [/box]
Crosses on Individual Stocks
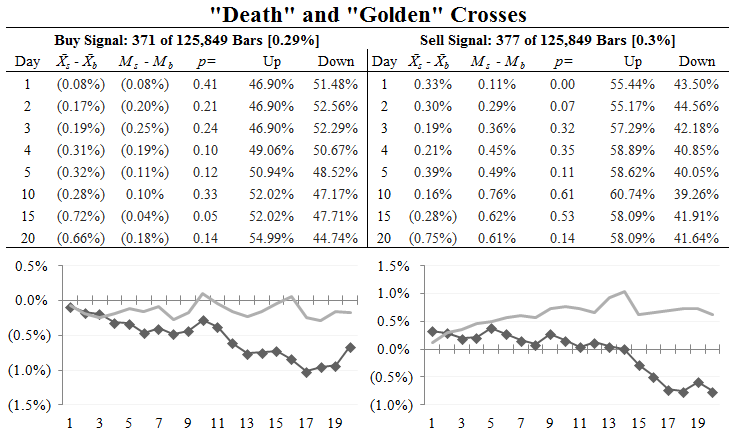
Both of these tests have been done on stock indexes. I thought it would also be interesting to look at the test on a basket of individual stocks. Here are the test results (in a different format) for a basket of 100 stocks, using the past 10 years of data. This will be a way to get more events to study, and also to look at a different asset class. (Individual stocks may or may not behave differently than stock indexes.)

This table is, perhaps, slightly harder to read, but it gives the same type of test results in more depth, focusing on a shorter time period (20 trading days after the event). I would suggest you focus on the second column in each box, which shows the excess return (X-X is the signal mean - baseline mean) and the p= column, which shows the p-value for the test. In this case, we see echos of the "weird" negative return that we saw in the DJIA test. ((This is, more or less, an artifact. The "juice", i.e., big returns, in stocks appear to happen at the extremes. Tests that select events more likely to be in the "middle" of the data (relative to high/low range), as this average crossing test does, are likely to show a natural element of underperformance.)) Most importantly, there is no clear and strong effect here.
[box type = "info"] Caution: Sample sizes with individual stocks
I just presented a test on over 125,000 daily bars. This would seem to be a lot of data, until you realize that stocks are very highly correlated, and many of these events were driven by the broad market, occurred on or near the same dates. It is easy to do tests on a large number of individual stocks, but avoid being misled by the sample sizes; assume that the tests are not as powerful as we might usually assume, given the apparently (and possibly misleadingly) large sample sizes.[/box]
The most important thing? A look at statistical significance
One of the problems with most tests of technical patterns is that statistical significance is rarely reported. When a technical analyst is telling you about a candlestick pattern or some other favorite technical tool, ask a question like "what is the t-value for that?" You'll be met by blank stares because a) that type of testing has not usually been done in technical analysis and b) traditional technical analysts are not used to thinking like this. Statistical significance and tests of significance are deep topics, and potentially divisive. Let me see if I can simply the subject and explain why they are so important.
Nearly all data includes some degree of noise or random fluctuation, and market data usually has a lot of random noise. What we're trying to do, with any test, is to peer deeply into that data and maybe tease out some real effect. To be able to do that, we have to be able to sort out what might be "real" or "significant" from what is random noise. Most traders know if they just go into the market and buy on five days over the past year randomly, there is a chance that they will make money on all five trades. The critical question we need to ask is how sure can we be that these results, no matter how good or bad they look, are simply random noise? What if we just got lucky?
Traditional tests of significance look at the data, the effect sizes, the amount of variation in the data, sample sizes, etc., and give us one answer to that question. (Note that even this answer only works within the bounds of probability. Stay humble, my friends. We don't really, truly know anything for certain!) This answer is often expressed as a p-value, which is the probability of "seeing a result at least as extreme as the one observed simply due to random chance." ((Formally, the last part of this sentence should read "given that the null hypothesis is true", but, for purposes of most market analysis, that null hypothesis is that the effect is due to randomness.)) Without that assessment, any test of a technical effect is bound to be misleading. We don't care that X was up Y% of the time after the event, that stocks rallied Z% following the super secret signal, or that buying with this system produced any number of wins over the past ten years. Those are examples of how technical results are often presented, but, without an assessment of statistical significance, they aren't terribly meaningful.
Surprise: a hidden gem
Look again at the test table for individual stocks, specifically at the Up and Down columns, that give the % of stocks that were up or down on those days following the event, without regard to the magnitude of those moves. (Note that the baseline was: up, unch, down : 50.6%, 1.02%, 48.38%.) What is going on here? Without going into a lot of supporting detail, this effect is due to mean reversion in stocks, which is a powerful force--almost overwhelming over some timeframes. Individual stocks mean revert strongly. Consider the case of a Death Cross, and the price movement required to generate that event. Nearly always, price will be going down, pulling the short term average through the longer term average; furthermore, the day of the event is almost certain to have a lower close than the day before. Simply buying stocks on this condition, a close lower than the day before, will result in a small win due to the power of mean reversion in stocks. This is also why quantitative trend following systems have trouble with individual stocks.
Perhaps think about your trading experience with individual stocks. What happens when you "chase" entries? How many breakouts fail? How many breakout trades are likely to snap back against you, if you enter on a strong day in the direction of the breakout? What do the statistics from your trading say? Though we might not have found an effect with the soundbite darlings, the Death and Golden Crosses, we have found something important: we've uncovered one of the fundamental principles of price behavior and seen it in action, and that's not a bad day's work.


