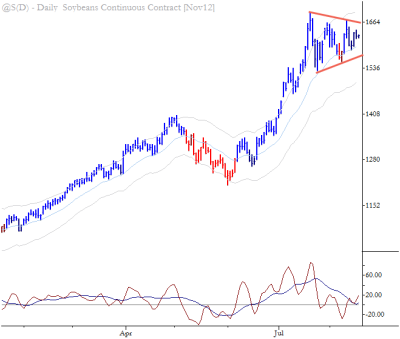
Chart of the Day: Volatility Contraction in Soybeans

Volatility contraction is an important element of market action. Essentially, when a market has been quiet for a period of time, there is a higher chance of breakout trades working, or of any sharp move seeing continuation (for several bars.) Though there are many ways to quantify this volatility contraction, a triangle chart pattern is often one of the easiest and most intuitive. (Consider that each of the previous up and downswings has been shorter than the preceding swings, indicating the volatility and trading interest are drying up.) Taken alone, this is a fairly bullish pattern in Soybeans, but given the potentially bearish action in the rest of the Grain complex, we must remember that there is good two-way potential in this pattern—a breakdown could well see downside continuation.


