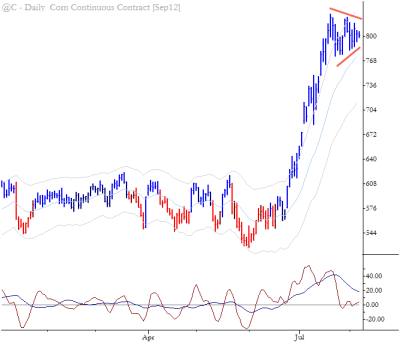
Markets alternate between periods of range expansion (usually during trends) and volatility contraction. Breakouts from periods of volatility contraction tend to be strong, and highly directional. This chart pattern in Corn futures highlights volatility contraction near the highs of a recent, large run-up; this is usually constructive and traders can look to position long on a breakout of this pattern. Also, consider that there will be trapped longs should this pattern fail, and have a clear plan for risk management to the downside. (Note that there is also the possibility of multiple locked-limit moves in the Grains.)
Chart of the Day: Volatility Contraction in Corn Futures
- Post author:AdamHGrimes
- Post published:08/07/2012
- Post category:General Comments
AdamHGrimes
Adam Grimes has over two decades of experience in the industry as a trader, analyst and system developer. The author of a best-selling trading book, he has traded for his own account, for a top prop firm, and spent several years at the New York Mercantile Exchange. He focuses on the intersection of quantitative analysis and discretionary trading, and has a talent for teaching and helping traders find their own way in the market.
You Might Also Like
This Post Has 2 Comments
Comments are closed.
I am reading your book – brilliant – one of the best I have read so far on technical analysis. Can you tell what is the significance of the blue & red bar coloring in your charts on the blog – Thanks
Hi Jayram. Answer here: https://adamhgrimes.com/2012/08/09/reader-question-color-rules/