Chart of the Day: Not a Bubble

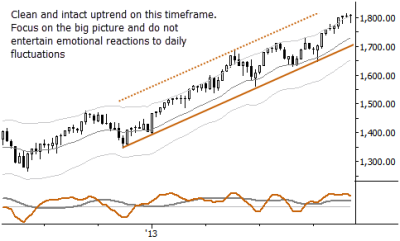
The media, both major and social, seems to be filled with people proclaiming that stocks are in a bubble. Bubbles do occur, but the current market shows no signs of a bubble. Bubbles have, historically, been associated with specific types of trend accelerations and volatility conditions, and have ended in a large, contra-trend volatility shock. The current bull market in stocks, and make no mistake—we are in a bull market, is polite and stable by comparison. (See the current weekly chart of the S&P 500 above.) I suspect what is going on is this: the bubble argument is just the most recent of a string of arguments explaining why it's wrong for stocks to go up, or why they cannot be going up. If so, this is simply healthy dissension that can fuel an extended trend. If everyone were bullish, then the bulls would have reason for concern.
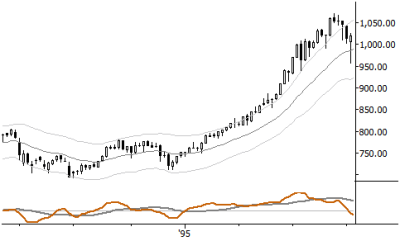
As another thought, it's quite difficult to call the end of bubbles. The following chart is the Nasdaq composite, showing many of the classic signs of a bubble… in 1995. This bubble would eventually top out—roughly 400% higher and five years later. Price pays. I suggest that much of your attention should be focused there.


