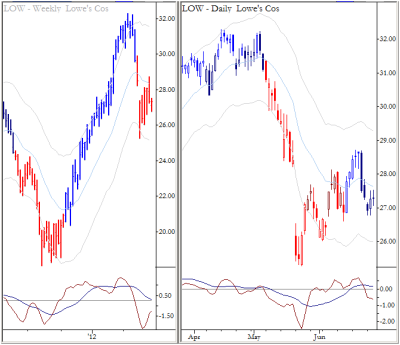
Chart of the Day: LOW (Nested Flag)

First, take a look at the weekly chart, which shows a classic Anti pattern. (Essentially a consolidation (think bear flag) following a potential trend change.) Now, look at the daily chart, and note two days of tight consolidation—this is an example of using a small technical trigger as an entry into a higher timeframe pattern. I'd be interested in shorting this under the consolidation (roughly 26.75), with a fairly wide stop that reflects the fact this is a trade on the weekly chart. This is also a good example of putting a potentially insignificant pattern into the context of a higher timeframe pattern that has good potential to drive price movement; I called this type of pattern a "nested flag" in the book.


