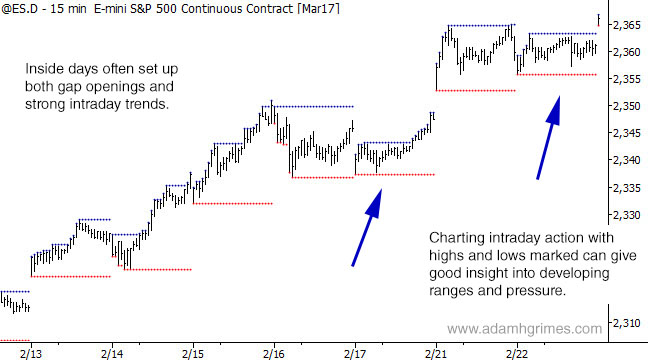
Chart of the day: intraday ranges in ES


Just a quick look at patterns and concepts applied in an actual trade. This was a trade that was shared with our MarketLife members in advance. Trades like this are easy, but only if you're looking in the right place at the right time. For context, trading has

In my previous post, I shared some perspectives on how I turned my lack of quantitative education into strengths. The structure that came from that process—not being afraid to get my hands dirty with the data, simulating multiple outcomes, and being willing to ask very basic questions—has served

In this post, I want to share some insights into my thought process as a trader. I will follow up with a post looking at Relative Volume. I originally defined, quantified, and coded that tool in 2009-2010, but it grew out of a foundation much deeper. My thought process might

Markets are always a mix of signal and noise — the trick is knowing when the balance shifts in your favor. This post breaks down how to spot those rare moments when an edge appears, and when to stand aside to avoid bleeding money in choppy conditions.