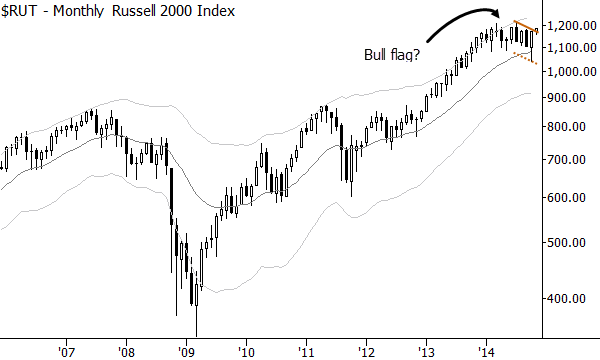
Buying the Russell 2000 index
A look at the technical justification and support for a long trade in the Russell 2000 index, or other US indexes.
I usually focus more on concepts and ideas on this blog, rather than putting trades out, but I want to do something different today. Let's take a look at the current market structure of the US stock market, and see why a tactical long trade could make sense here.
The big picture has three important parts to consider:
- Recent market action is constructive. Stocks typically press to new highs and pull back. Major indexes have been holding at new highs with little movement. This is also evidence of volatility compression, which usually sets up a strong directional move.
- Much ado has been made about small cap underperformance in 2014. My read on this is that it is quite likely simply a very large-scale pullback. Most technicians are not used to thinking of trends that extend over months or quarters, and we must do so to understand a setup in stocks that has multi-year potential. If stocks rally, smaller caps will likely come roaring back.
- The screaming, multi-month bull flag in the Russell 2000. As a stand-alone pattern, this is important and convincing.

Capturing a pattern like this is not easy for most traders, and particularly for most technical traders. There's a tendency to micro manage and to focus on moves that might not be significant. One solution is to use this as broad context, and focus on shorter term patterns and setups that are in alignment with this big, overarching bullish context. To that end, we initiated a long position in the Russell in my Waverly Advisors research yesterday, but there are many ways to play this pattern. Looking at leading sectors, or sectors with potential for leadership (Healthcare, Financials, Technology--possibly add Discretionary to that list), could also be a good idea, either on the sector level, or drilling down to individual stocks.
As with any trade, remember we are just playing the probabilities here. Stops are essential; there's always a good chance the trade will be wrong. Particularly for traders trading daily patterns within the monthly context, it can be hard to walk away from losing trades, but we must do so, as proper stops for the monthly pattern could be as much as 15% below current prices! Keep an eye on this pattern, and on the relative performance of smaller caps over the next few months--there's tremendous potential here.


