Breakouts and breakout failures: real world trading

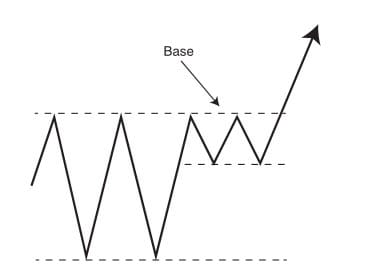
One of the disconnects for new traders is seeing how patterns play out in the real world. When we learn patterns, we usually start from pristine, idealized examples. But in actual trading, things get messy and simple patterns are not so simple. Breakouts and breakout failures can give us some good lessons. Let's look at a recent example in corn.
It makes sense to start with those idealized examples. Seeing clean examples of patterns can help us build a template in our head, saying, “this is what a good pattern looks like.” Or maybe, “this is the expected resolution of the pattern.” But if we don’t go the next step and look at some examples with surprises, we are missing important lessons.

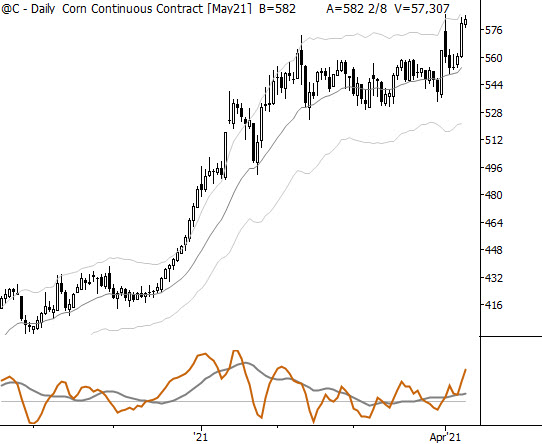
Look at this setup in corn futures, as of 3/31/21. (What you can’t see from this chart is that corn has been in a long and strong uptrend, going all the way back to August 2020.) We have a long sideways consolidation under important highs—this is typically bullish. Then we had a strong up day; a > 3 sigma single day rally, and the biggest gain since the consolidation began.
What would you expect to happen from this point?
This is a classic breakout setup. The long consolidation is enough to work off any potential overextension. We also use the phrase “building a base” to mean that price has done enough work sideways to support an extended rally.
Couple this setup (i.e., potential) with the one day momentum trigger, and there was every reason to expect a blast off through those old highs on the next day.
But the market had other plans…

Now look at the chart above. (I deliberately left these charts clean and didn’t draw any lines to guide you. Look back to that previous pivot high. See that the current bar (last bar on the chart) traded far through that high, and then reversed down to close below yesterday’s close.) This seems to be a classic breakout failure, right?
This is now, in fact, a failure test setup, and you’d be fully justified being short, or maybe going short under that last bar’s low.
In a single bar, the dynamics of the pattern have changed from bullish to bearish. (Here’s another important lesson: that’s not always the case. More often, a pattern failure shifts us to neutral or to no bias. Developing traders forget that there’s a huge middle ground where we should have no opinion on a market.)
This is a type of bar that justifies getting out of a long position on close, or maybe even flipping to short. Baseline expectation from here is for strong selling to develop, probably target a run to the bottom of the range.
Let’s see what happens next…

A failure test is a “tipping point” pattern, meaning that it shows a strong one bar shift in market dynamics. We have a reasonable expectation of immediately followthrough, and there’s a good lesson here.
When you have a pattern like this (and remember most technical patterns are not this immediate), a failure to follow through should shift your focus to the bigger picture.
There are few good physical world analogues here, but imagine you have a glass bowl. You drop that bowl and it doesn’t break. Your thinking might be “ok I guess that bowl is stronger than I thought.” The longer-term pattern (the uptrend stretching back to August and the months-long sideways breakout base) is the bowl. The failure test is equivalent to dropping the bowl—an event that could really change that big picture.
Now, you can think yourself in circles with failed failures of failures, and I’ve seen traders do this. (There’s one semi-famous trading book that nests this five levels deep: the author finds himself talking about failures of failures of failures of failed failures. Eh….?) I don’t think there’s some great hidden narrative here. The idea of trapped traders having to scramble and move the market in a way that only you can foresee because only you can read these patterns is naïve, at best. I think it’s better to just think a few steps ahead and try not to assume we know things that are unknowable.
But what is clear from the last chart above is that the market is not breaking down—bears are not winning. There has been no downside momentum, no selling pressure, following a clean short trigger.
In this case, we’d be smart to start thinking about that longer-term upside potential…

And this last chart is the pattern as it's playing out this morning as I write this blog. Back to new highs, and now showing every appearance of a good upside breakout.
So what are the actionable lessons here? Let's think about it like this:
Patterns play out in unexpected ways.
We need to be able to separate out big picture patterns from small, one or two bar patterns.
Sometimes the short term matters most. We should understand "tipping point" patterns as well as possible.
If patterns don't play out like we expect, reduce risk in open trades or get flat.
Remember, no bias, no edge, and flat are perfectly valid positions!


