Basic backtesting in Excel: How to keep learning
My goal was to put simple, but powerful, tools into your hands so you can start doing the work to understand how the market moves. In this, the last, post in the series, I will do two things. First, we'll wrap up some unfinished business from yesterday's post and think a bit about how to understand market stats. (That's a more complicated topic than it might seem to be!) Last, I'll point you along a path that will let you keep developing these skills, from just going a little beyond what we've done here all the way to learning complete programming languages.
Avoiding common errors
You're going to make mistakes; just accept that from the beginning. I think our path through market analysis, if we were to map it, would be a jagged map with many excursions and course corrections. Don't be afraid about the mistakes, but try to learn from them. Spend as much (or a lot more) time thinking through what you're doing as actually doing the analyses, and you'll start to develop some real skill.
Going back to yesterday's example, I highlighted an error I deliberately made with a red warning text. Here's a good general principle: one of the worst errors we can make is to let future information contaminate a test, and this can happen in many subtle ways. One way to find this error is to think, in detail, about how you could actually trade and execute the tendency you are testing. In the example I gave, we separated market returns into those above and below the moving average and found that returns above the moving average were much higher. I have seen similar tests with "homerun" stats reproduced in many places--books, blogs, tweets--but these stats are misleading and dangerous.
If we wanted to capture returns above the moving average, we have to be long when the market closes above the moving average. This much is obvious, but the problem comes on the day price closes above the moving average after it has been below. To get that return, you had to buy on the previous close. How did you know to do that? You did not know that price was going to close above the average today, so there's no way you could have known to buy on yesterday's close.
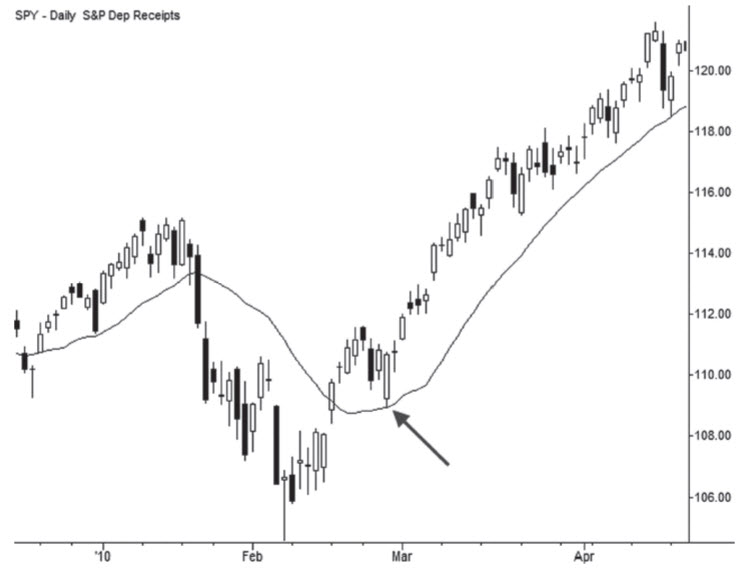
Oh, so you say you want to buy at or on the moving average? You realize there will be some false signals and have to account for those, but surely there are enough examples of the moving average acting as support or resistance that you might find an edge. After all, look at this example. Wouldn't you like to buy here?

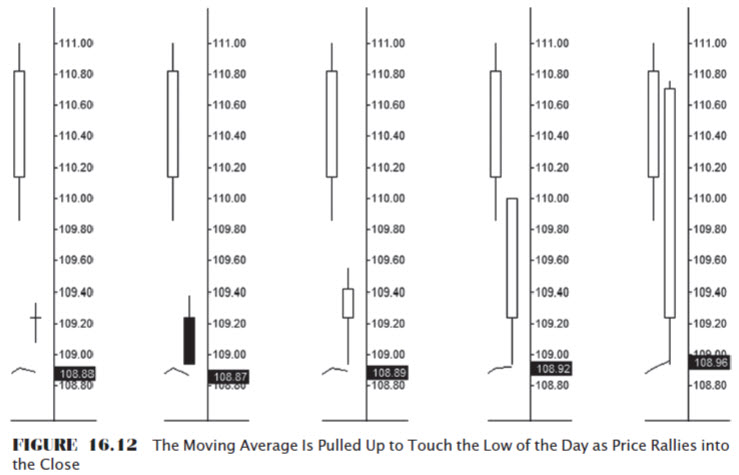
This seems like a pretty good idea, but, as you might suspect, there is a problem: When do you know the moving average price? How is the moving average calculated? It's an average of the last X days' prices, including (uh oh) today's close. Take a look at the following chart, drawn from the unpublished part of my book:

It's a strange chart, but it includes five snapshots from the same trading day and shows how the moving average price developed as the closing price for that bar changed. There was no way we could have bought at the moving average that day, as the moving average was "pulled up" into the low of the bar by the very high close. Sometimes the "future leaking to the past" errors are not so obvious! I wrote a post on the simple version of that leakage, and that post will help you think through some of the many ways in which this error can bias your tests. (Also, assume that most market stats you see published in the media (social and otherwise) fall prey to some type of this bias unless the person or firm doing the stats applies rigorous standards. Most people quoting a lot of stats don't apply those standards because there aren't that many meaningful/interesting stats--the market is far more random than people wish to accept.)
Understanding stats
The next thing I think we need to do is to keep developing our sense of probability and statistics. The most important point is to understand randomness because randomness is the enemy. If something is random then we can't depend on it or make money trading it. If we are looking at stats that are based on random "garbage" then we are wasting our time. The bad news is that there is not reliable way to say with absolute certainty that something is or is not random. If I put a thousand green marbles in a bag and three red marbles, there is a (vanishingly small) chance that you would reach into that bag three times and just happen to draw the three red marbles. That's the bad news.
The good news is that we do have tools and techniques that can help. Much of our technology and society is based on probability and on being able to understand what is (very) probably not random. If we did not have those tools, then there would be no medicine, computers, airplanes, modern buildings... well, you get the idea. I wrote a short primer that will help you get started thinking about market stats if you are near the beginning of the journey. If you're a bit further along, dig deeply into the techniques, and, even more importantly, the concepts and issues with significance testing.
Developing skills
Where do you go from here? In this series of posts, you've gotten some basic skills, and I want to point out that you need to keep using them to develop them. A certain amount of this is muscle memory, and you need to internalize keyboard shortcuts and data manipulations. I would take the basic sheet we've built, and create a sheet that can read your results and calculate further statistics. Next, try some more interesting tests:
- What happens when a market has been up/down N days in a row? (What about exactly N days? In other words, if you're testing N=4 and you have five days up consecutively, there's only one entry, not two.)
- What do high or low levels in the VIX say about future stock prices?
- What do large changes, up and down, in the VIX say about future stock prices? (These tests are not the same.)
- Any information when the VIX diverges from calculated historical volatility?
- How about seasonality? Test different days/weeks/months of the year for different asset classes. (Treat this as a mini masterclass in significance testing.)
Next steps probably include going beyond Excel. For instance, what if we have 2 assets (or 20) and want to be long the one (or 5?) that have the best relative strength over a period of time and rotate with different rules? That's possible, but cumbersome, to do in Excel, and you probably need to look at VBA (google it) when you get to those questions with complicated trading rules.
After spending some time there, the next steps would be to bite the bullet and just learn to program, but that's a bit beyond the scope of these posts. :) I hope you have enjoyed these posts and have found them useful. I'll do my best to keep up with comments/questions as they come in, with one caveat: let's keep the scope of these posts. If there are questions that go far beyond, I may defer. The only way to understand the market is to understand how the market has typically behaved, and now you have some tools to work toward that understanding. Good trading.


